Sunday, February 24, 2019

Berkshire Hathaway 4Q2018 Results Analysis & Fair Value Estimate

Berkshire Hathaway (BRK.B) 4Q2018 Results show that company continues to power ahead growing operating earnings at a good clip and growing intrinsic value at a low double digit rate. Failure to deploy excess capital continues to be the primary concern for the company.


Mritik Capital values BRK.B shares to be valued between $230 to $250. An investor in BRK benefits from access to $185B of Equity Assets ($75 per share), $132B in Cash and Fixed Income Assets (~$54 per share) and has access to 80 child companies that are fully owned which produce significant operating earnings of $20B+ ($8.13+ per share) and the best insurance franchise in the world with float of $122B (~$50 per share). The $20B operating earnings ($8.13 per share) comprises of $9.4B in Manufacturing, Service and Retailing, $5.3B in BNSF Railroad, $2.6B in BH Energy, $2.3B 10 year average annual Insurance Underwriting,  $0.5B in Finance and Financial Products. BRK also has Corporate Debt excluding Railroad and Utilities of $35B ($14.2 per share) and $51.4B of Deferred Income Tax Liability ($20.9 per share) and $120B of Insurance Long Term Liability ($48.8 per share).

Mritik Capital currently values BRK by adding up the parts $75 + $50 + 16*8.13 - 14.12 -0.20*20.9 - 0.20*48.4 = $255.08 - $27.98 = ~$227.

Mritik Capital projected value at 2019 end for BRK by adding up the parts $81.3 + $55 + 16*8.75 - 14.12 -0.20*24 - 0.20*50 = $276.30 - $28.92 = ~$247.

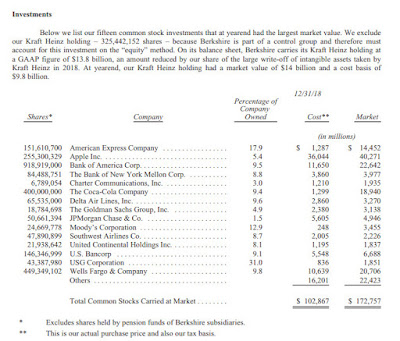
Below are select details from 2018 year end financial report.

Note: The deferred income tax and insurance liability are long term and are discounted ti be at a 15% rate. If BRK does not sell shares they never need to pay the tax and also new insurance premiums each year offset payouts so float can be perpetual or long lasting.


BRK 2018 Annual Results

Thursday, February 21, 2019

Canadian National Railway - Primed for Growth

Canadian National Railway (CNI) is Primed for Growth having recovered business momentum after switching CEO in early 2018.


CNI has arguably the best network footprint among North American Railroads due to its unique access to 3 coasts on Pacific (Asia access), Atlantic (Europe access) and Gulf Coast (South America and Africa access). CNI also has access to Prince Rupert closest port to China and Halifax the closest port to Europe from North America giving it a competitive advantage. CNI also has an advantage due to EJ&E outer belt access in Chicago.


CNI has the most diverse business mix with no segment accounting for more than 25% and also the least coal exposure among North American Railroads. CNI also has the strong Lumber, Auto and Intermodal franchise.


CNI Financial Results over the last 7 years since economic recovery after 2009 financial crisis is highlighted below.


 CNI has generated great returns for shareholders since IPO in 1996. CNI has raised dividend 16% CAGR since IPO and string total returns.


CNI estimates EPS for 2019 of C$6.25 up 14% from C$5.5 in 2018. CNI has raised dividend by 18% recently to C$2.15 per year in Feb 2019 which will be a 33% payout ratio. Over the last 2-3 years UNP, CSX, NSC, CP have outperformed but Mritik Capital expects CNI to perform the best among peers over the next 3-5 years. CNI currently trades for US$86 (C$113.5) which is 18 times forward earnings and is fairly valued. CNI yields ~2% currently and plans to spend C$2.5B in share buyback for 2019.


Canadian National Railway Feb 2019 Presentation

Wednesday, February 20, 2019

Analysis of North American Pet Products Market

Below is a snapshot that helps in Analysis of North American Pet Products Market.
Out of ~125 million families in North America it shows more than 100 million cats and dogs are owned. I suspect many same families own both a dog and a cat. Even if we estimate 80 million unique per owning families it is 2/3 of the families.


The total Pet Care market is worth $70B in annual sales. Companies like PetSmart and Perco who operate in this space are owned by Private Equity now. Amazon is a growing presence in this market as well for pet supplies. This is a sector to watch.


Zoetis (ZTS) which is now $45B market cap is a company that produces medicines and vaccines for pets and livestock. This is the best company to invest in this space as it gives expose to the pet market but also has diversification due to its exposure to livestock market as well. ZTS has always traded at a premium since it’s spinoff from Pfizer (PFE) in 2013. Company is up from $31 to $95 now as earnings have kept growing and the company is much better run as an independent company. Company trades for 27 times forward earnings. Mritik Capital recommends a purchase price at the 20 times multiple of forward earnings or better is a recommended entry point for ZTS. Based on 2019 projected EPS of $3.5 the recommended purchase price is $70.


Sunday, February 17, 2019

Berkshire Hathaway - 4Q2018 Capital Allocation Issues

Berkshire Hathaway (BRK.B) 4Q2018 Capital Allocation Issues continue to be a concern looking at the public security disclosures from 15 Feb 2019. There were no significant capital outlays to buy stocks in 4Q 2018 even when S&P touched a bear market by correcting 20%. BRK had estimated excess liquidity of $100B by 2018 year end.


Warren Buffett controls the majority of cash, bond and stock holdings worth $220B as the Chief Investment Officer and CEO. Ted Weschler and Todd Combs each control $11B while Warren controls ~ 200B. BRK has not made any major acquisitions since the $36B acquisition of Precision Cast Parts (PCP) with the deal being announced in mid 2015 and closing in Jan 2016.


Unless BRK spent a significant portion of capital doing share buybacks in 4Q2018 and in first 2 months of 2019 to the order of $20B+ it would be very disappointing performance by BRK management. The operating companies continue to operate reasonably well. Buffett should give up the Chairman role at Berkshire so that board of directors can assess and select a new CEO for the next generation to come. Large companies like Amazon (AMZN), Alphabet (GOOGL), Microsoft (MSFT), Facebook (FB) who have market caps comparable to BRK or larger have been able to continue to invest and grow value. These companies have less number of business markets and industries while BRK has multiple avenues to deploy capital and grow value due to the 80+ subsidiaries and investment mandate to invest in any industry and any geography. BRK has also avenues to deploy cash internationally to buy entire businesses which they have failed to do.

BRK year end results are due 22 Feb 2019 and based on the results and capital allocation performance it may be time to turn to new leadership.

Tracking Warren Buffett's Berkshire Hathaway Portfolio - Q4 2018 Update

Brookfield Asset Management - 4Q2018 Results Analysis

Brookfield Asset Management (BAM) 4Q2018 Results Analysis

BAM reported 4Q and Full Year 2018 results that showed continuous value creation and growth of the operating earnings, asset value per share, assets under management and plan value. Dividend was also increased by 7% to $0.64 per year at a 15% payout ratio.

FFO per share for 2018 was $4.35. Mritik Capital estimates 2020 end FFO per share to be $6 per share.


Assets Under Management (AUM) increased to $355B and Fee Paying AUM (FPAUM) increased to $138B with significant growth in Private Funds AUM and reduction in Listed Entities AUM. Fee related Earnings increased 31% to $1.1B, Annual run rate of Fees and Target Carry increased 25% to $3B. Free Cash Flow per year increased to 24% to $2.4B.

Mritik Capital estimates Total AUM to trend to $400B+ by 2020 end and FPAUM to rend towards $175B+. Mritik Capital estimated Annual run rate of Fees and Target Carry by 2020 end to be $4B and Free Cash Flow is projected to be $3.5B which would be $3.5 per share.


BAM share price return on a year year basis was flat but long term return over 10 years and 20 years has been 17% per year.


BAM performance highlights over the last years shows continued progress as below.


BAM fair value as of 2018 end Mritik Capital projects to be $50+. Mritik Capital projects $60+ per share value for BAM by 2020 end.


BAM 4Q2018 Letter To Shareholders

BAM 4Q2018 Results Presentation

Sunday, February 10, 2019

Brookfield Business Partners - 4Q2018 Results Analysis

Brookfield Business Partners (BBU) 4Q2018 Results Analysis shows growth in operations and progress towards becoming a diversified industrial and services company with operation excellence and optimized capital structure.

BBU is facing some challenges in its Multiplex operations in Middle East which has been a disappointment dragging down the better results in UK and Australia. Ideally this child company needs to turn around and start paying annual dividends to the parent. It has a backlog of $8B as of now 85% of which is in UK and Australia. There are also some challenges in the Teekay Offshore Marine Services business which is restructuring and trying to grow out of its debt.

On the positive side operations in Graftech (EAF) continue to be strong and cash generation over next 4 years using long term contracts (65% of capacity) significant value can be extracted and redeployed. It is quite possible that EAF may still retain significant value beyond that based on where Graphite EAF prices end up. EAF currently trades at $3.82B market Cap ($6B enterprise value) which implies a $1.03B value to 27% ownership of BBU in EAF.

BRK Ambiental the Water Services business is well positioned for growth in 2019 and 2020 with the new Brazil governments focus on sanitation and business friendly regime. Other Services business perform to expectations.

Westinghouse seems to be well on its way to a turnaround with already 33% of initial capital investment dividend out after just 6 months of operations. There is a good possibility that Westinghouse could end up being a multi-bagger investment just like EAF over next 2-3 years  once costs are optimized, customer service excellence is entrenched and there is a strategic acquisition in the power infrastructure services are to grow this company.

BBU acquisition of Healthscope in Australia which owns 43 hospitals in Australia and a market leading international pathology operation (clinical labs) in New Zealand is a promising entry into the Health Care Infrastructure and |Services business. It would be interesting if this knowledge can be applied to the North American market over the next 2-3 years to make an entry in the long term nursing care industry. BBU plans to invest $250M as its share in Healthscope which equates to ~ $1.95 per unit of BBU.

BBU acquisition of Johnson Controls Power Solutions (Battery) business in mid 2019 could provide another great opportunity to diversify and grow the company and work its magic by optimizing the operations and capital structure of the company. BBU plans to invest $750M as its share in Power Solutions which equates to $5.8 per unit of BBU.

During the year 2018 BBU invested approximately $500 million in high quality businesses across our sectors and geographies and generated $1.5 billion from monetization activities. There is scope of significant per unit asset value growth at BBU over next 4 years. The company has come a long way since its spin off from BAM in 2015. We believe the units are valued at between $45 to $50 range which is significantly higher than the $32 recent trading range. The key question is whether units will continue to languish at a large discount to NAV over the long term due to the external management by BAM and the fee structure. Inspite of this discount if BBU grows its per unit NAV over the next 4 years the market will need to re-rate the stock and BAM has incentive to have the units trade close to NAV to continue to harvest incentive fees so interests are well aligned in out opinion. We ascribe a target price of $45 to $50 for 2019 year end.

BBU 4Q2018 Letter To Unitholders

BBU 4Q2018 Results Presentation

Brookfield Renewable 4Q2018 Results - Powering On

Brookfield Renewable (BEP) 4Q2018 Results were in line with expectations. The company is Powering On towards its mission of achieving 12-15% total return per year. BEP raised its dividend by 5% to $2.06 per year from $1.96 per year. With units trading at $29 which is a 7% current yield and a 5-9% dividend growth projected the likely forward annual return achievable is 12% to 16%.

BEP is progressing cost reducing initiatives in Colombia Isagen Hydro and in US at Terraform Power (TERP) wind and solar assets. BEP also is lengthening PPA contracts in Colombia and Brazil and has most US contracts locked in till 2029. BEP has select development projects ongoing and also has possible acquisitions in India after a patient wait of 6 years. BEP has potential upside with partial asset dispositions (while retaining control) to pension funds as they are doing to Canadian assets at sub 5% cap rate.

Overall we believe BEP is operating well and generating growing free cash-flow and well positioned to grow in its market of Global Renewable Power Generation. We believe BEP is worth $32 to $35 per unit.

Brookfield Renewable 4Q2018 Letter To Unitholders

Brookfield Renewable 4Q2018 Presentation

Thursday, February 7, 2019

BPY 4Q2018 Results Analysis

BPY 4Q2018 Results were solid with Office Occupancy at 93.5% (up from 92.5% year ago) and Retail Occupancy at 96.5% (up from 96% year ago). Rents for expiring leases were up 8% in office and 11% in retail so we don’t see a retail Armageddon yet. They sold out the US Logistics IDI acquires in 2012-2013 to Quebec Pension Plan for $3.5B which was a 20% IRR and 2.5 times multiple over the 6 years.

They increased dividend by 5% to $1.32 per year. At the $14.92 price of BPY on Dec 24 2018 this is 8.8% dividend yield. BPY at $18.70 today is still a good price and we think the units are at least worth $25. BPY announced a Substantial Issuer Bid (Type of Buyback in Canadian Law) for $500M at prices between $19 and $21 which is good for retiring 2.5% of shares. As of now there are 974M shares ($1.06B shares including dilution from conversion of preferred shares and other convertible securities).

The stock will likely trade at these low valuations over next 1-2 years until they pay down debt from GGP acquisition and until they prove that retail malls can be tuned into multi use properties with office, hotels and apartments.

BPY 4Q2018 Results

BPY 4Q2018 Letter To Unitholders

Wednesday, February 6, 2019

Brookfield Infrastructure Partners 4Q2018 Results Analysis

Brookfield Infrastructure Partners (BIP) reported 4Q2018 Results.

 FFO was $3.11. Stock is trading at $38.5 which is 12.4 times FFO multiple. FFO was flat in 2018 compared to FFO of $3.11 in 2017. BIP did a lot of asset rotation this year and was impacted by currency depreciation in Brazil, Australia which was more severe than expected.

In 2 years time we can expect FFO to be above $4 as they close on announced transactions and make new investments and raise rates. If stock trades at same multiple we can expect to see $50 stock while we also receive 5.25% dividend in mean while. Dividend was raised from $1.88 per year to $2.01 which is a 7% raise. We can expect dividend increases to be stronger over next 2 years as FFO grows and if USD strength against BRL, AUD, CAD, GBP reverses there is more upside.

Brookfield Infrastructure (BIP) Reports 2018 Year-End Results

Monday, February 4, 2019

GOOGL 4Q2018 Results - Revenue Growth & Margin Moderation

Alphabet (GOOGL) 4Q2018 Results show 22% Revenue Growth to $39B. EPS wasm12.77. Profit margin trending down to 22% from 24%.

Amazon as a new competitor while Facebook (FB) remains its primary competitor in advertising. 
Cloud and Other Bets businesses (Waymo etc.) hold some promIse but not yet material to impact top and bottom line.

GOOGL has net cash of $104B which equates to $150 per share. At current trading price of $1100 excluding cash a buyer pays $950 per share so assuming $48 to $50 EPS in 2019 one is paying 20 times earnings. GOOGL is a good value as a company that is a dominant market leader with secular tailwind in online advertising and growth prospects in AI trading at 20 times forward earnings excluding cash.

Alphabet 4Q2018 Results